生命科学を支える 細胞生物学
News / Topics
新着お知らせ
-
CSF論文発表のお知らせ
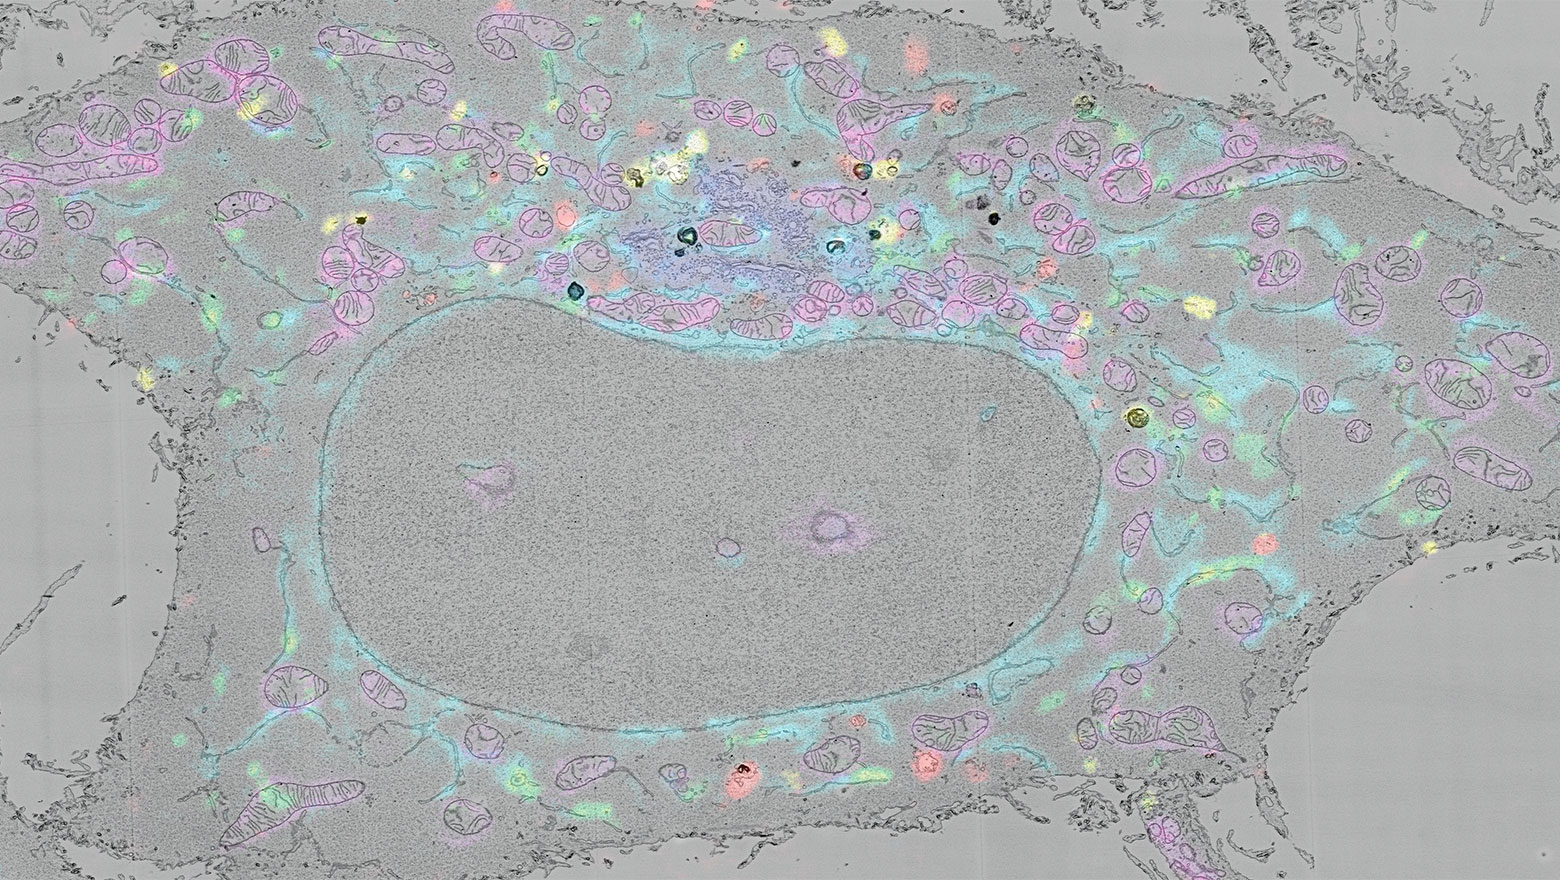
Identification of Rab30 as a novel regulator of tubular endosomes
本研究では、Rab30がTBC1D22Bの新規標的であり、エフェクター分子であるBICD2やKIF5Bと協調して管状エンドソーム形成に関与することを見出した。
-
CSF論文発表のお知らせ
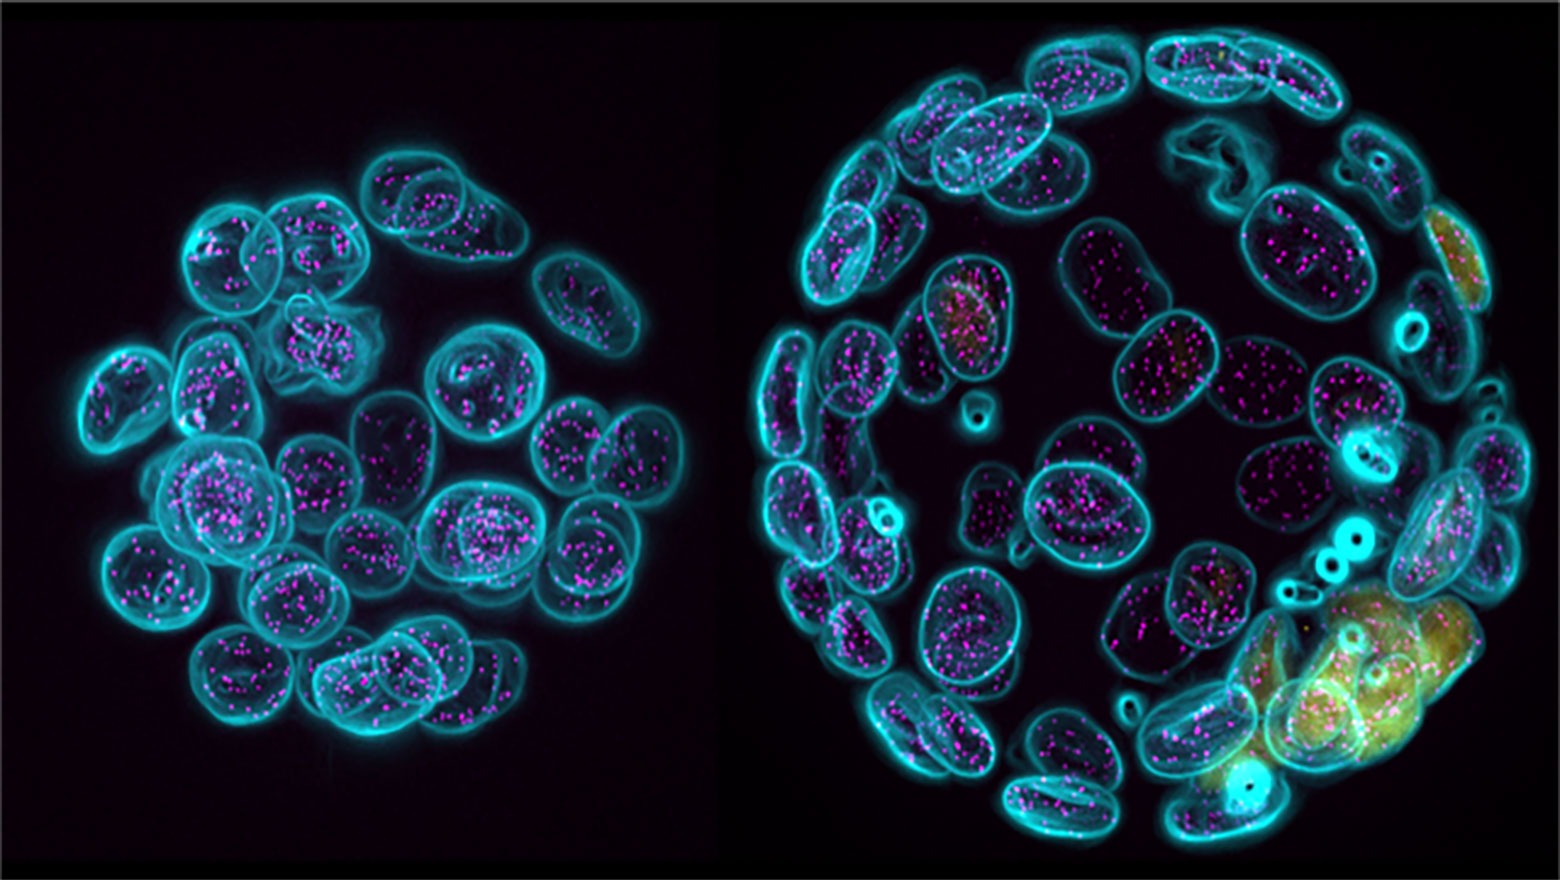
Changes in nuclear morphology and size in mammalian temperature-sensitive mutants
細胞核の伸長とDNA複製との関連や、核の肥大とDNA損傷の増加そして異常な核の出現との関連が見出されました。
-
CSF論文発表のお知らせ
Functional analysis of miR-199a-3p in tumor endothelial cells
腫瘍血管内皮細胞に高発現するmiR-199a-3pがテトラスパニンCD151の発現抑制を介して細胞外マトリックスへの接着低下と遊走能を亢進させた.さらに細胞増殖,浸潤促進をもたらした.miR-199a-3pが腫瘍血管内皮細胞の高い血管新生能の獲得の機序の一部であることが示唆された。
-
CSF論文発表のお知らせ
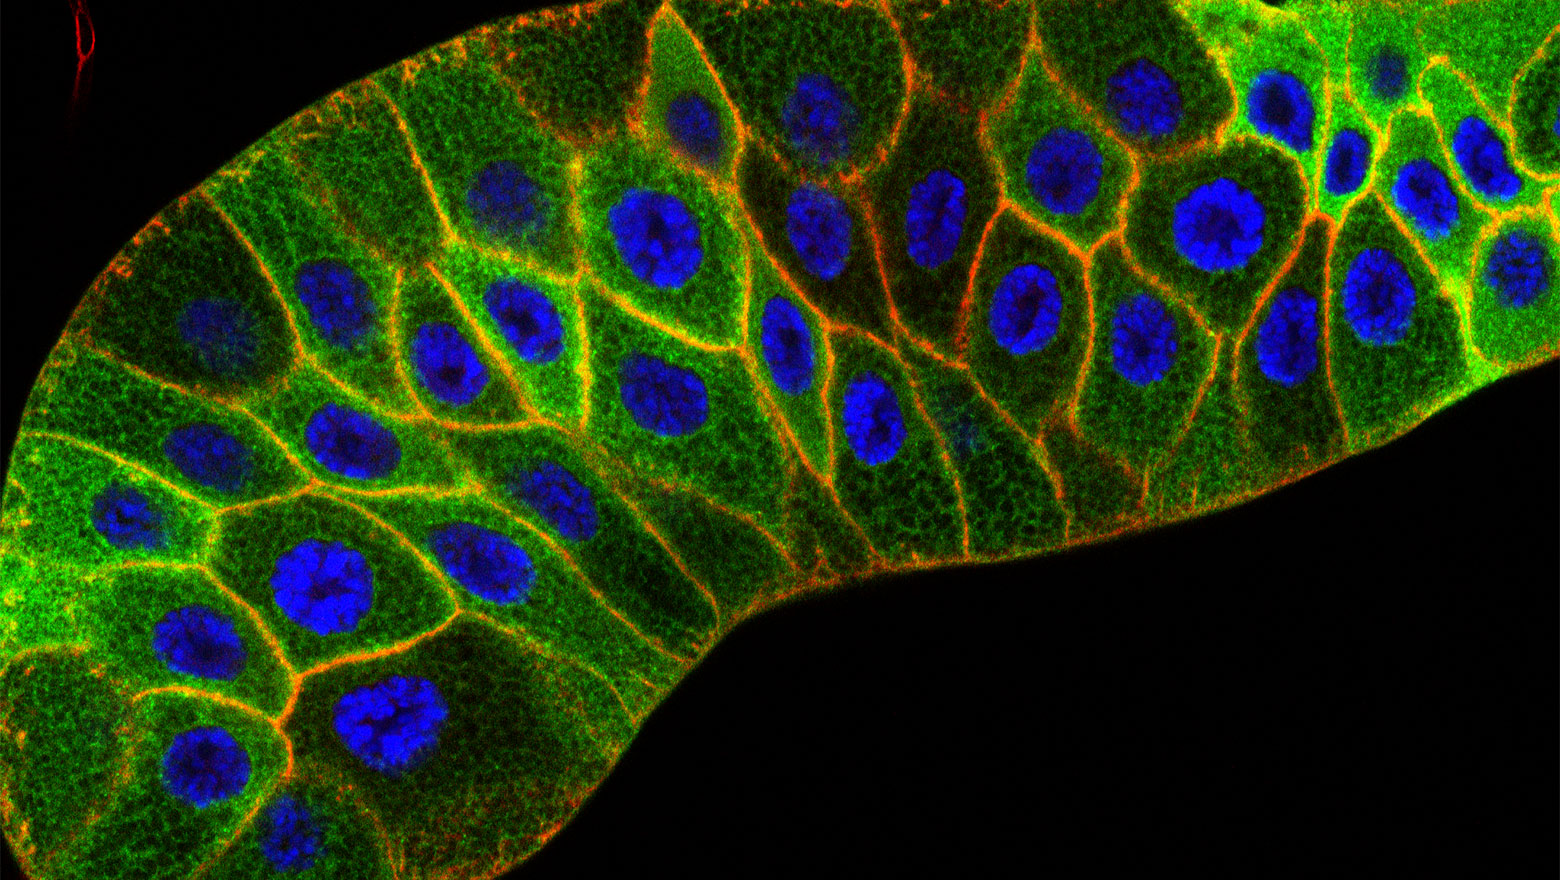
Down-regulation of proliferation-inhibiting factor EGR1 in brain metastatic cancer cells on a soft matrix
本研究は、軟らかい細胞外基質上のメラノーマ高脳転移株では増殖抑制因子であるEGR1の発現が低いことを示しました。
-
CSF論文発表のお知らせ
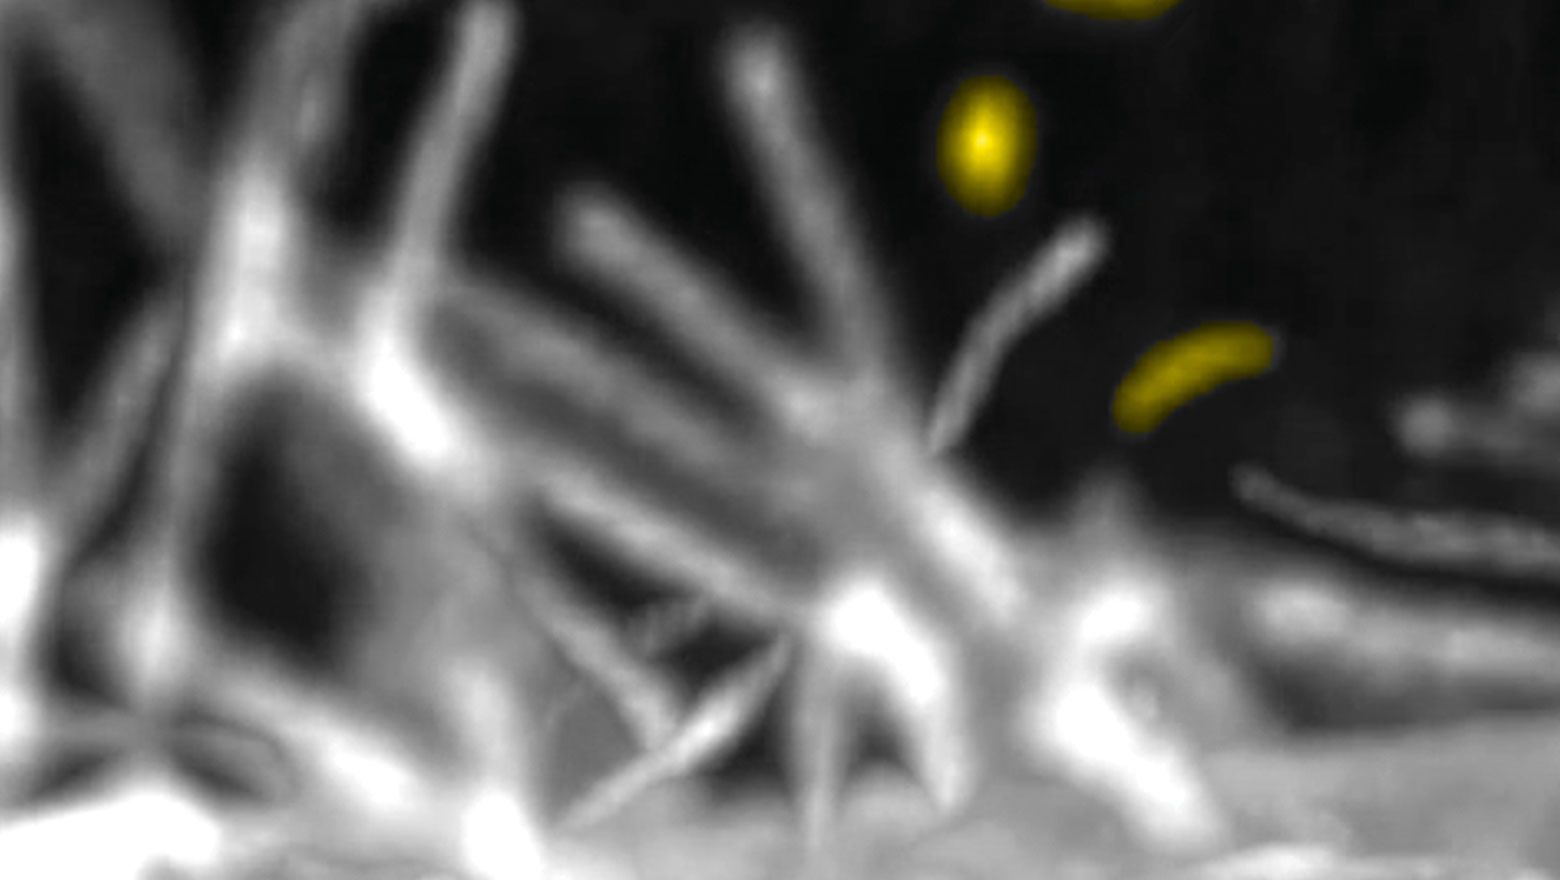
A mei-P26 is required for initiation of meiosis in the Drosophila male germline
TRIM-NHLファミリーに属するショウジョウバエのMei-P26は、雄の減数分裂の開始に必要である。
Journal
会報「細胞生物」
Events
学術大会・イベント
About
当学会について